Bandwidth graphs
We do not usually show these kind of metrics, but they are indeed followed and monitored :)
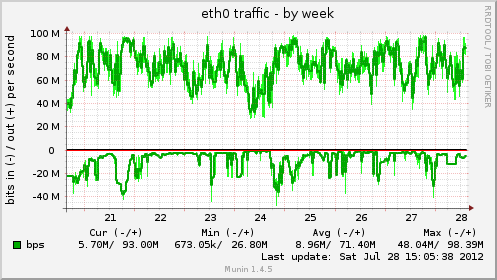
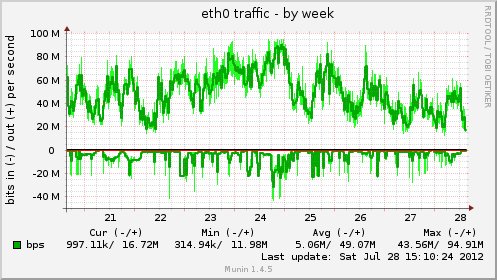
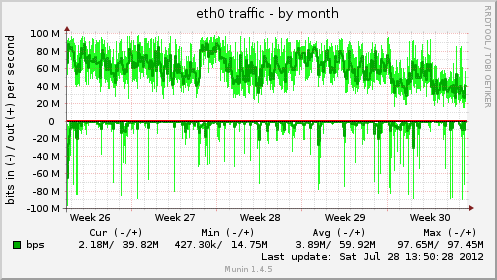
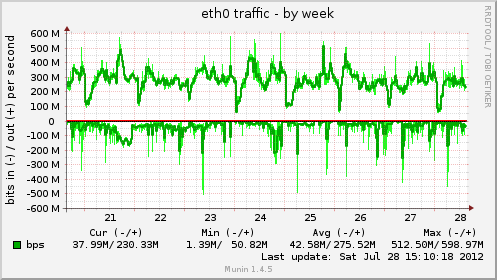
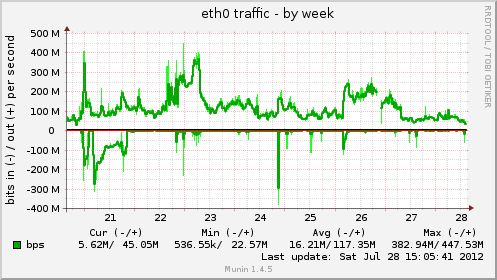
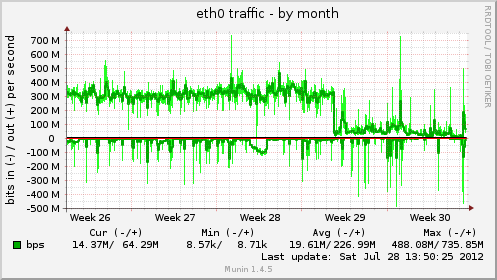
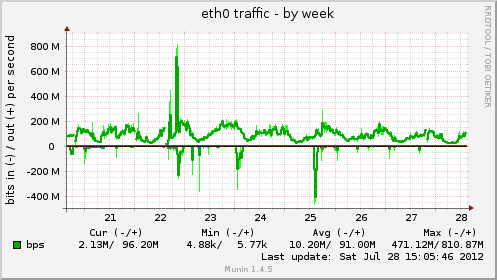
We took a small random selection of 2009+ Starter and 2012 series servers, and here are the graphs. As you can see the very high value of our services and the stable performance. Some of the variation is due to users changing on the servers, and these graphs do not show short bursts as they are per week or per month.
2009+ Starter
2012 Series
شنبه, July 28, 2012

